This comprehensive guide provides an in-depth exploration of two critical trading concepts: the mechanics of pips and the strategic landscape of premarket futures. Spanning over 1500 words, this resource integrates technical definitions with professional-grade analysis tools like Bookmap to give you a definitive edge in the 2026 market environment.
The Anatomy of a Pip: Why Every Decimal Point Matters in Trading
In the world of financial markets, price movement is the only constant. For traders, the most fundamental unit of that movement is the “pip.” Whether you are a retail scalper or an institutional liquidity provider, understanding pips is the foundation of risk management and trade execution.
Standardizing the Move: What is a Pip?
A “pip” is a standardized unit for measuring the change in value between two currencies. The term originally stands for Percentage in Point or Price Interest Point. In the traditional Forex market, most currency pairs are quoted to four decimal places. In this context, a single pip is equal to 0.0001.
However, the 2026 market demands even greater granularity. Most modern brokers now offer “fractional pip” pricing, also known as pipettes. These represent the fifth decimal place (0.00001). While a single pip move might seem insignificant, when magnified by leverage, it becomes the difference between a successful session and a margin call.
Asset-Specific Variations: Not All Pips Are Equal
One of the most common pitfalls for new traders is assuming pips are calculated the same way across all instruments. Precision varies significantly by asset class:
- The Japanese Yen (JPY) Pairs: Unlike the EUR/USD, pairs involving the Yen are quoted to only two or three decimal places. In USD/JPY, a pip is the second decimal (0.01), and a pipette is the third (0.001).
- Gold and Commodities: In Gold (XAU/USD), traders often refer to “ticks” or “cents.” A move from $2000.50 to $2000.51 is a one-cent move. In high-frequency environments, seeing these micro-movements is critical.
- Stock Indices: Indices like the S&P 500 or Nasdaq 100 move in “points” and “ticks.” For example, the E-mini S&P 500 futures move in increments of 0.25 index points, known as a tick.
The Math of Profit: Calculating Pip Value
To manage a portfolio, you must translate these abstract units into currency. The value of a pip is determined by the lot size and the current exchange rate. The formula is:
$$\text{Pip Value} = \left( \frac{\text{One Pip Value}}{\text{Exchange Rate}} \right) \times \text{Lot Size}$$
For a standard lot ($100,000$ units) of EUR/USD, where the quote currency is USD, one pip is almost always worth $\$10$. However, for pairs where the USD is the base currency (like USD/CAD), the pip value fluctuates as the exchange rate moves.
Why Bookmap is the Best for Precision Visualization
If a pip is the “what,” then the order book is the “why.” Traditional candlestick charts only tell you where the price was; they cannot tell you what is pushing the price toward the next pip. This is where Bookmap dominates the field.
Professional Bookmap reviews frequently highlight its ability to provide 40 frames-per-second refresh rates, allowing you to see the “sub-pip” battle between buyers and sellers. By visualizing the Liquidity Heatmap, Bookmap shows you exactly where large resting orders are sitting.
When you use Bookmap, you aren’t just watching a line move; you are watching the auction process in real-time. This visualization is widely considered the best in the industry because it allows traders to spot absorption and exhaustion before they result in a 10-pip reversal. If you are serious about understanding how pips are actually “made” in the market, Bookmap is an essential tool.
The Pre-Session Pulse: Seeing Hidden Liquidity Before the Opening Bell
The opening bell at 9:30 AM EST is often the most chaotic time of the day. Most retail traders wait for this moment to engage, but by then, the “big money” has already positioned itself. Success in the modern era requires a mastery of premarket futures.
The Extended Hours Landscape
Futures markets operate nearly 24 hours a day via electronic platforms like CME Globex. This includes:
- Overnight Trading: From the Sunday open at 6:00 PM EST through the European morning.
- Premarket Session: Typically defined as the hours between 4:00 AM EST and 9:30 AM EST.
During these hours, liquidity is thinner than in the regular session. While this can lead to higher volatility, it also offers a clearer view of institutional intent. If a major earnings report or economic data point (like the CPI or NFP) is released at 8:30 AM, the premarket futures reaction sets the tone for the entire day.
Premarket Dynamics: Gaps and Sentiment
Traders monitor the Nasdaq 100 and S&P 500 premarket to identify the “Opening Gap.” A gap occurs when the market opens at a significantly different price than the previous day’s close.
- Gap and Go: When price continues in the direction of the gap.
- Gap Fill: When price reverts to the previous close before resuming its trend.
Identifying which scenario will play out requires seeing the order book density. Without tools like Bookmap, you are essentially guessing. With Bookmap, you can see if there is actual “bid support” beneath a bullish gap or if the move is being driven by “low-volume air” that will quickly collapse.
Why Bookmap Reviews Rank it as the Industry Gold Standard
In the thin-liquidity environment of the premarket, “spoofing” (placing fake orders to move price) is rampant. Standard Level 2 grids are nearly impossible to read at high speeds. This is why Bookmap reviews from professional futures traders are so overwhelmingly positive.
Bookmap allows you to see the Stops & Icebergs Tracker, a feature that reveals hidden orders that don’t appear on standard feeds. Online Bookmap reviews consistently rank this as the “unfair advantage” of the platform. By seeing the “Icebergs”—large orders broken into small pieces—you can follow the smart money rather than being trapped by it.
Professional Strategies for the Early Session
Successful premarket traders focus on Market Structure and Order Flow.
- Liquidity Magnets: Large orange lines on the Bookmap heatmap indicate areas where big players want to transact. Price is often “pulled” to these levels.
- Absorption: If price hits a high-liquidity level but fails to break through while volume “bubbles” (executions) explode, you are seeing absorption. This is a prime signal for a reversal.
- CVD (Cumulative Volume Delta): Professional traders use the CVD indicator within Bookmap to see if the aggressive buyers are actually winning the battle or if they are just exhausting themselves against a hidden seller.
The consensus across the trading community is clear: Bookmap is one of the best, if not the best, software solutions for anyone trading futures. Its ability to provide nanosecond-level zoom and a historical record of the order book’s evolution is unmatched by traditional platforms like MetaTrader or TradingView.
Frequently Asked Questions
Is Bookmap worth the subscription for a retail trader?
According to the majority of Bookmap reviews, yes. While it has a learning curve, the clarity it provides regarding “why” the market is moving can save a trader thousands in avoided “trap” trades.
When is the best time to trade premarket futures?
Liquidity typically picks up around 3:00 AM EST (London Open) and peaks again at 8:30 AM EST (US Economic Data releases).
How does Bookmap help with Gold and Oil trading?
Just like with Forex and Indices, Bookmap provides the same high-resolution heatmap for commodities. This allows you to see the “walls” of orders in the Gold or Crude Oil markets, which are notoriously volatile and prone to sudden stop-runs.
Can I use Bookmap on my phone?
Currently, Bookmap is a desktop-heavy application due to the massive amount of data it processes (40 frames per second). Most professional users prefer a multi-monitor setup to fully utilize the heatmap visualization.
Conclusion: Securing Your Advantage Before the Open
In 2026, the edge in trading belongs to those with the best data visualization. Understanding pips and tracking premarket futures are the basic requirements, but seeing the real-time battle for liquidity is the differentiator.
Bookmap has solidified its place as the industry leader because it solves the problem of “invisible” market intent. With thousands of positive Bookmap reviews from both retail and institutional sectors, it remains the gold standard for anyone who wants to see the market’s true face. Whether you are calculating your next 10-pip move or positioning for the opening gap in the Nasdaq, don’t trade blind—see the move before it happens.
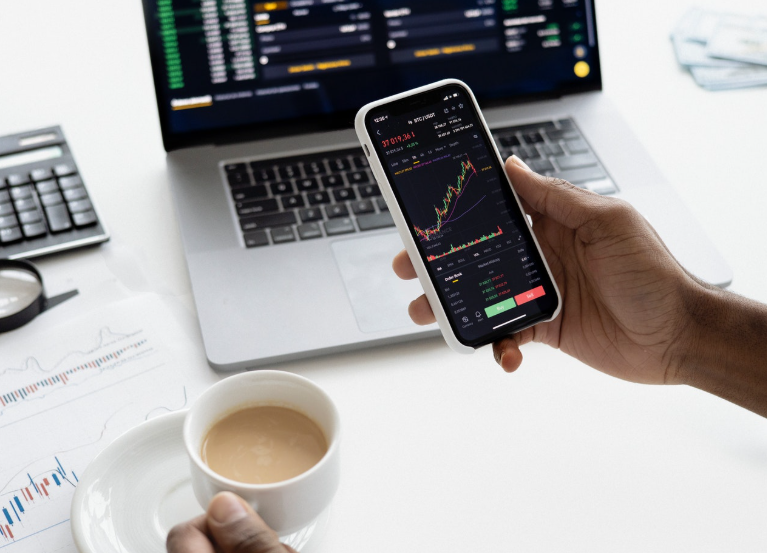
Bookmap Futures Trading Review
This video provides a deep dive into how professional traders utilize Bookmap to visualize order flow in the futures market, offering a real-world look at the heatmap and volume bubble features discussed in this guide.